Stockpile Volumes
The volume of a stockpile can be readily calculated from comparing two surfaces. We are commonly asked to work out the volume of material in a stockpile. The completed stockpile survey is then processed to give two surfaces that we can then compare to calculate a volume. This is then drawn up showing the contours of the stockpile and the volume that has been calculated. Drawings are commonly presented in A3 hard copy or pdf versions.
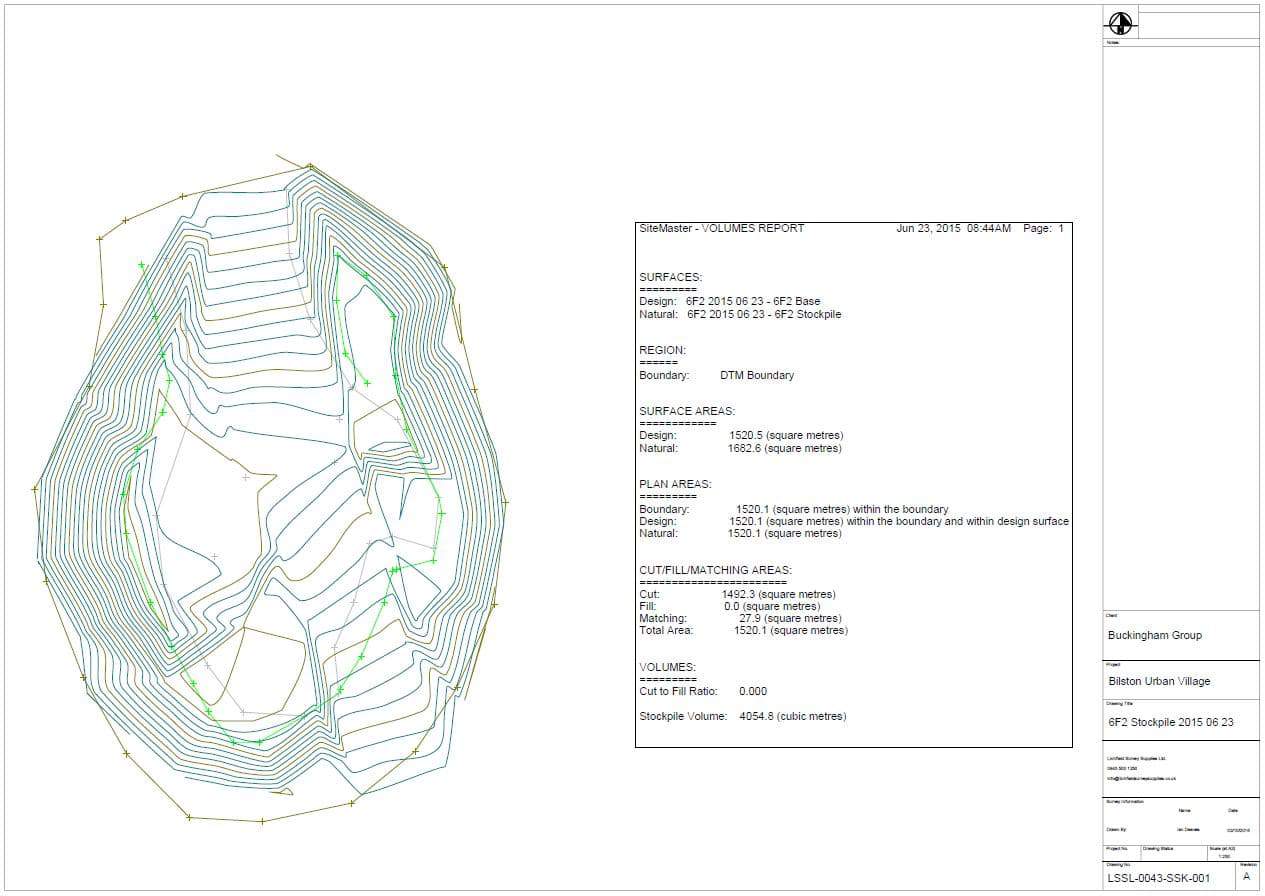
This Stockpile Volume was calculated for a client. We used the outside base points as a flat plane to create the first surface. We then used all the points on the survey to create another surface, this time above the first (flat plane) surface.
Comparing these two surfaces together we can determine the surface areas of both DTM’s (Surfaces) and also the volume between these two DTM’s (Surfaces). The drawing to the left is the visual representation of the top of the stockpile with contours added.
The information from the DTM’s is added and then the drawing is produced in pdf format, or can be issued in a CAD format.
If you require a stockpile volume, similar to the one above, working out then please get in contact with us.
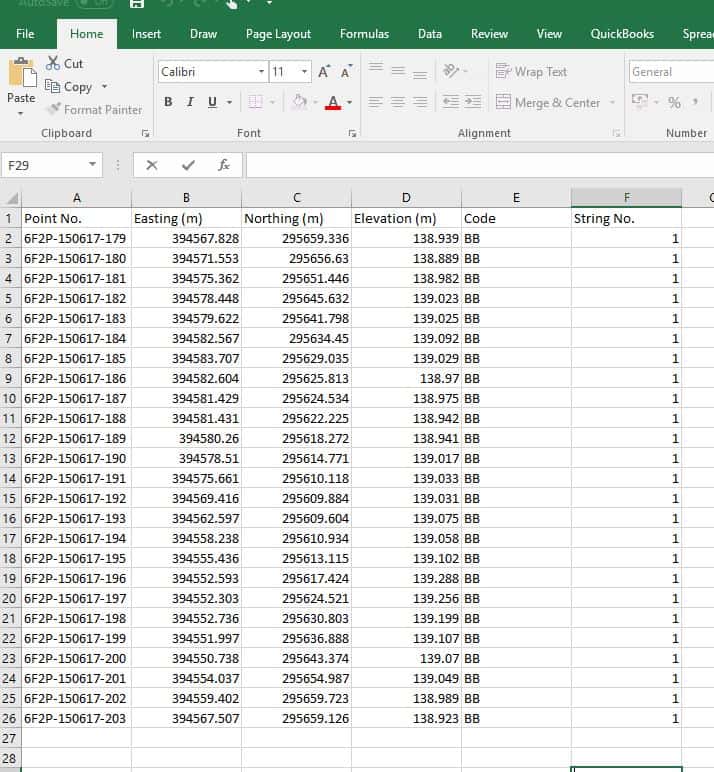
We now offer a service where we can calculate your stockpile volume from your data. You need to supply the data in a csv (comma separated values) format for both the base of the stockpile and the finished surface of the stockpile.
We have an example of the type of data that you would need to provide for us to calculate the stockpile volume for you. It is in an excel format and can be viewed here.


To easily have your stockpile volume calculated then please visit the shop or follow this link to Stockpile Volume Calculation.